Linux MongoDB系统性能分析
最近我们的一台内网Linux服务器经常报卡,里面部署了MongoDB,专供mongo分析查询用。平时的应用场景应该是集中于mongo的读写。
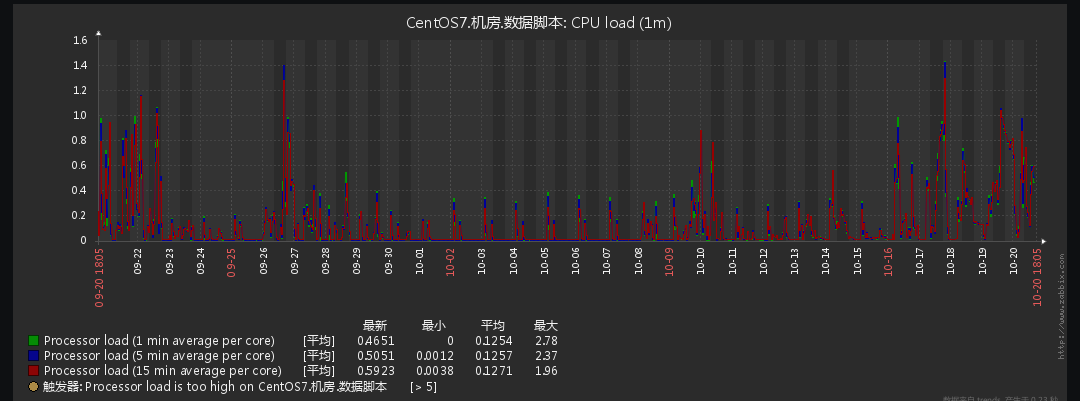
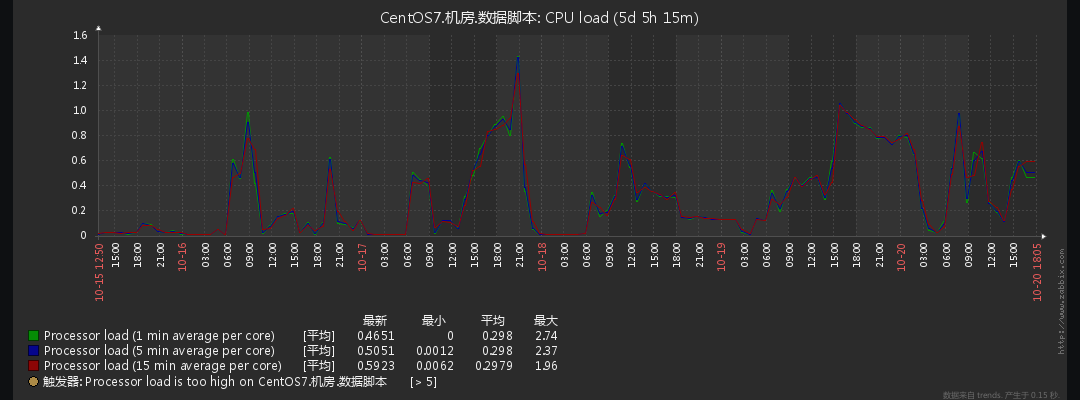
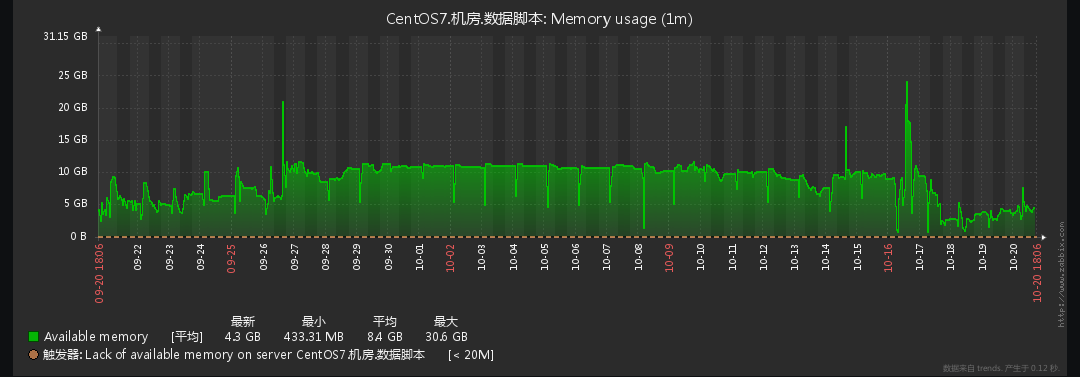
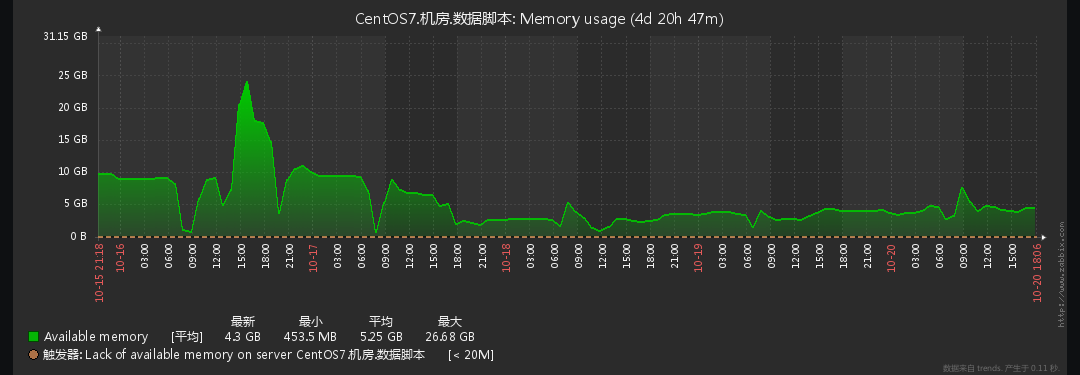
可能随着数据量增多,数据需求增多,各种开始慢查询,已经慢到令人发指。开始解决。幸运的是,这台机器之前部署过zabbix可以通过比对历史数据看一下,发现是在10月16日后服务器开始异常:
系统性能部分
首先分析机器性能是否出现问题,主要通过如下几个部分去看:
1. 谁在占用CPU
CPU占用最多的前10个进程:
ps auxw|head -1;ps auxw|sort -rn -k3|head -10
实际执行效果:
Xserver ➜  ~  ps auxw|head -1;ps auxw|sort -rn -k3|head -10
USER       PID %CPU %MEM    VSZ   RSS TTY      STAT START   TIME COMMAND
mongod    3248 35.9 67.2 25835136 21956952 ?   Sl   Sep26 11848:07 /usr/bin/mongod -f /etc/mongod.conf
somebody   2561 35.1  0.6 1177872 208232 pts/10 Sl+  14:07   2:24 mongorestore --db removeAfterUse --collection topicWeeklyMeta ./dump/eventsV4/eventV4.bson --quiet
master   13309  3.5  8.9 14303376 2911760 ?    SNl  Oct17  99:28 java -jar dataProcess-0.0.1-SNAPSHOT-allinone.jar
master   13643  1.8  8.9 14297216 2913104 ?    SNl  Oct17  51:44 java -jar dataProcess-0.0.1-SNAPSHOT-allinone.jar
master    2414  1.3  0.0 669528 10324 pts/17   Sl+  14:06   0:06 mongotop
somebody   2784  1.2  0.0 603992  9876 pts/7    Sl+  14:09   0:03 mongotop
root        76  0.6  0.0      0     0 ?        S    Sep26 215:33 [kswapd0]
root      2638  0.4  0.0      0     0 ?        S    14:08   0:01 [kworker/7:10]
master    2490  0.4  0.0 122784  2512 pts/12   S+   14:07   0:02 htop
somebody   3093  0.2  0.0 667440  7308 pts/5    Sl+  14:11   0:00 mongostat
实际CPU状态可以反映出CPU占用大户是mongod,这个符合预期。其余的几个mongo进程是临时任务可以理解。
使用top去看系统负载load average: 4.68
2. 谁在吃内存
检查内存占用情况
free -h可以直观的看出目前内存的消耗情况,但这个值不能作为真实内存剩余空间看待,使用cat /proc/meminfo更方便阅读。
Xserver ➜  ~  free -h
total        used        free      shared  buff/cache   available
Mem:         31G         30G        234M   17M/587M        569M
Swap:        31G        7.6G         24G
查看内存占用的top 10
Xserver ➜  ~  ps auxw|head -1;ps auxw|sort -rn -k4|head -10
USER       PID %CPU %MEM    VSZ   RSS TTY      STAT START   TIME COMMAND
mongod    3248 35.9 67.2 25836164 21950496 ?   Sl   Sep26 11851:09 /usr/bin/mongod -f /etc/mongod.conf
master   13643  1.8  8.9 14297216 2913104 ?    SNl  Oct17  51:45 java -jar dataProcess-0.0.1-SNAPSHOT-allinone.jar
master   13309  3.5  8.9 14303376 2911768 ?    SNl  Oct17  99:31 java -jar dataProcess-0.0.1-SNAPSHOT-allinone.jar
somebody   2561 25.5  0.6 1177872 208248 pts/10 Sl+  14:07   2:24 mongorestore --db removeAfterUse --collection topicWeeklyMeta ./dump/eventsV4/eventV4.bson --quiet
shiny    30481  0.1  0.2 327288 82360 ?        S    13:40   0:03 /usr/lib64/R/bin/exec/R --no-save --slave -f /opt/shiny-server/R/SockJSAdapter.R
shiny    29684  0.1  0.2 438640 72096 ?        Sl   13:33   0:04 /usr/lib64/R/bin/exec/R --no-save --slave -f /opt/shiny-server/R/SockJSAdapter.R
shiny    31549  0.0  0.1 264488 47632 ?        S    13:46   0:00 /usr/lib64/R/bin/exec/R --no-save --slave -f /opt/shiny-server/R/SockJSAdapter.R
root      4221  0.0  0.1 985852 62828 ?        Sl   09:34   0:03 /opt/shiny-server/ext/node/bin/shiny-server /opt/shiny-server/lib/main.js --pidfile=/var/run/shiny-server.pid
zabbix     912  0.0  0.0  89224   316 ?        S    Sep26   1:05 /usr/sbin/zabbix_agentd: active checks #1 [idle 1 sec]
zabbix     910  0.0  0.0  89344   728 ?        S    Sep26   4:45 /usr/sbin/zabbix_agentd: listener #3 [waiting for connection]
VSZ(或VSS)列 表示,程序占用了多少虚拟内存。虚拟内存可以不用考虑,它并不占用实际物理内存
RSS列 表示, 程序占用了多少物理内存。
可以看出top1的mongo占用了约20GB的内存,top2/3的java共占去4GB的内存。这里也基本符合机器使用的预期。MongoDB本身就是通过占用内存来提升效率的。
3. 高耗任务有哪些
接下来着重分析top和htop排序出的高耗能任务。系统负载值load average: 4.72, 3.88, 3.02。调查一下这些高耗能任务跑了多久:
ps -eo pid,tty,user,comm,stime,etime | grep mongo
实际执行效果
Xserver ➜  ~  ps -eo pid,tty,user,comm,stime,etime | grep python
 4557 pts/10   somebody  python3         14:24       07:43
 5270 pts/2    somebody  python3         14:31       01:23
11727 pts/0    somebody   python3         05:17    09:14:37
14417 ?        somebody   python3         Sep27 21-17:04:23 //任务非当天开始执行,这里显示了任务开始时间
20737 ?        somebody  python3.5       Oct13  5-21:02:32
22010 ?        somebody  python3.5       Sep29 19-23:14:23
23423 ?        somebody  python3.5       Oct13  6-02:23:56
Xserver ➜  ~  ps -eo pid,tty,user,comm,stime,etime | grep mongo
 2401 pts/19   master   mongostat       14:06       26:05
 2414 pts/17   master   mongotop        14:06       26:00
 3248 ?        mongod   mongod          Sep26 22-21:13:56
11126 pts/20   somebody   mongo           05:11    09:20:53
32297 pts/18   master   mongo           13:53       39:21
Xserver ➜  ~  ps -eo pid,tty,user,comm,stime,etime | grep java
13309 ?        master   java            Oct17  1-22:51:21
13643 ?        master   java            Oct17  1-22:50:29
Xserver ➜  ~  ps -eo pid,tty,user,comm,stime,etime | grep R
  PID TT       USER     COMMAND         STIME     ELAPSED
29684 ?        shiny    R               13:33    01:01:30
30481 ?        shiny    R               13:40       55:02
31549 ?        shiny    R               13:46       48:33
这些高耗能任务中,有些任务一直在常驻内存中,抽样PID 14417去看,该进程的虚拟内存申请了700M左右,却没有任何动静。刚好在Oct17日,有一个java程序部署到服务器内,也是调查的入手点。
Xserver ➜  ~  top -p 14417
top - 14:41:37 up 22 days, 21:31, 17 users,  load average: 1.43, 2.41, 2.64
Tasks:   1 total,   0 running,   1 sleeping,   0 stopped,   0 zombie
%Cpu(s):  5.0 us,  0.9 sy,  1.2 ni, 84.3 id,  8.7 wa,  0.0 hi,  0.0 si,  0.0 st
KiB Mem : 32664172 total,   231856 free, 28669088 used,  3763228 buff/cache
KiB Swap: 33226744 total, 30181140 free,  3045604 used.  3675172 avail Mem

  PID USER      PR  NI    VIRT    RES    SHR S  %CPU %MEM     TIME+ COMMAND
14417 somebody    20   0  761672      0      0 S   0.0  0.0   0:00.00 python3
top详解:
a PID 进程id
b PPID 父进程id
c RUSER Real user name
d UID 进程所有者的用户id
e USER 进程所有者的用户名
f GROUP 进程所有者的组名
g TTY 启动进程的终端名。不是从终端启动的进程则显示为 ?
h PR 优先级
i NI nice值。负值表示高优先级,正值表示低优先级
j P 最后使用的CPU,仅在多CPU环境下有意义
k %CPU 上次更新到现在的CPU时间占用百分比
l TIME 进程使用的CPU时间总计,单位秒
m TIME+ 进程使用的CPU时间总计,单位1/100秒
n %MEM 进程使用的物理内存百分比
o VIRT 进程使用的虚拟内存总量,单位kb。VIRT=SWAP+RES
p SWAP 进程使用的虚拟内存中,被换出的大小,单位kb。
q RES 进程使用的、未被换出的物理内存大小,单位kb。RES=CODE+DATA
r CODE 可执行代码占用的物理内存大小,单位kb
s DATA 可执行代码以外的部分(数据段+栈)占用的物理内存大小,单位kb
t SHR 共享内存大小,单位kb
u nFLT 页面错误次数
v nDRT 最后一次写入到现在,被修改过的页面数。
w S 进程状态。(D=不可中断的睡眠状态,R=运行,S=睡眠,T=跟踪/停止,Z=僵尸进程)
x COMMAND 命令名/命令行
y WCHAN 若该进程在睡眠,则显示睡眠中的系统函数名
继续抽样程序用strace调查发现有些报错都集中于futex上,大概理解是Kernel的锁机制。为什么产生这么多锁错误。有人遇到过类似的坑,不知道我们是不是这个问题。
Xserver ➜  ~  ps -ef | grep java
master   13309     1  3 Oct17 ?        02:33:11 java -jar dataProcess-0.0.1-SNAPSHOT-allinone.jar
master   13643     1  1 Oct17 ?        01:17:37 java -jar dataProcess-0.0.1-SNAPSHOT-allinone.jar
master   23478 21548  0 14:33 pts/10   00:00:00 grep --color=auto --exclude-dir=.bzr --exclude-dir=CVS --exclude-dir=.git --exclude-dir=.hg --exclude-dir=.svn java
Xserver ➜  ~  strace -c -f -p 13309
Process 13309 attached with 104 threads
Process 23507 detached
Process 23515 detached
% time     seconds  usecs/call     calls    errors syscall
------ ----------- ----------- --------- --------- ----------------
 81.18   82.026243        1728     47472     18776 futex
 ...........
  0.00    0.000000           0         1           munmap
  0.00    0.000000           0         3           writev
  0.00    0.000000           0         2           madvise
------ ----------- ----------- --------- --------- ----------------
100.00  101.039336                 51989     18955 total


Xserver ➜  ~  ps -ef | grep mongod
mongod   16369     1 99 08:56 ?        07:32:28 /usr/bin/mongod -f /etc/mongod.conf
master   23726 21548  0 14:36 pts/10   00:00:00 grep --color=auto --exclude-dir=.bzr --exclude-dir=CVS --exclude-dir=.git --exclude-dir=.hg --exclude-dir=.svn mongod
Xserver ➜  ~  strace -c -f -p 16369
% time     seconds  usecs/call     calls    errors syscall
------ ----------- ----------- --------- --------- ----------------
 79.50  963.050886      452562      2128           recvfrom
 14.52  175.884783         564    311933    123868 futex
  4.31   52.217454       16385      3187           nanosleep
  1.29   15.587801         511     30475           select
  0.24    2.858952      178685        16        12 restart_syscall
futex wait bug / futex errors的最佳解决方案是升级kernel,这里有关于这个BUG的详细解释:
sudo rpm -q --changelog kernel-`uname -r` | grep futex | grep ref
4. 硬盘
莫非硬盘读写到极限?我们的硬盘是Intel 730 SSD 实测读速度可以达到450M/s
使用iotop查询结果如下, 读写加一起都没到100M:
Total DISK READ :      63.84 M/s | Total DISK WRITE :      11.66 K/s
Actual DISK READ:      63.56 M/s | Actual DISK WRITE:       0.00 B/s
  TID  PRIO  USER     DISK READ  DISK WRITE  SWAPIN     IO>    COMMAND
 4566 be/4 mongod     63.84 M/s    0.00 B/s  0.00 % 79.43 % mongod -f /etc/mongod.conf
 7132 be/4 somebody     0.00 B/s   11.66 K/s  0.00 %  0.00 % python3.5 /usr/local/bin/pip3 install bokeh
24576 be/4 somebody     0.00 B/s    0.00 B/s  0.00 %  0.00 % python3.5 /usr/local/bin/jupyter-notebook
    1 be/4 root        0.00 B/s    0.00 B/s  0.00 %  0.00 % systemd --switched-root --system --deserialize 21
    2 be/4 root        0.00 B/s    0.00 B/s  0.00 %  0.00 % [kthreadd]
    3 be/4 root        0.00 B/s    0.00 B/s  0.00 %  0.00 % [ksoftirqd/0]
14340 be/4 mongod      0.00 B/s    0.00 B/s  0.00 %  0.00 % mongod -f /etc/mongod.conf
    5 be/0 root        0.00 B/s    0.00 B/s  0.00 %  0.00 % [kworker/0:0H]
20486 be/4 mongod      0.00 B/s    0.00 B/s  0.00 %  0.00 % mongod -f /etc/mongod.conf
    7 rt/4 root        0.00 B/s    0.00 B/s  0.00 %  0.00 % [migration
但是不能只观察一个时间的使用,抽样不同时间,某个使用高峰期,磁盘的读需求已经很高:
Total DISK READ :     325.36 M/s | Total DISK WRITE :     587.86 K/s
Actual DISK READ:     326.33 M/s | Actual DISK WRITE:     321.18 K/s
  TID  PRIO  USER     DISK READ  DISK WRITE  SWAPIN     IO>    COMMAND
18604 be/4 mongod     36.86 M/s    0.00 B/s  0.00 % 83.54 % mongod -f /etc/mongod.conf
18660 be/4 mongod     38.23 M/s    0.00 B/s  0.00 % 77.65 % mongod -f /etc/mongod.conf
18657 be/4 mongod     35.00 M/s    0.00 B/s  0.00 % 77.15 % mongod -f /etc/mongod.conf
27726 be/4 mongod     51.74 M/s    0.00 B/s  0.00 % 76.24 % mongod -f /etc/mongod.conf
18627 be/4 mongod     49.44 M/s    0.00 B/s  0.00 % 72.78 % mongod -f /etc/mongod.conf
26062 be/4 mongod     35.14 M/s    0.00 B/s  0.00 % 62.79 % mongod -f /etc/mongod.conf
16796 be/4 mongod     20.54 M/s
针对硬盘使用分析,还有Mongo官方推荐的工具iostat,直接看%util,如果 %util 接近 100%,说明产生的I/O请求太多,I/O系统已经满负荷。
同时可以结合vmstat 查看查看b参数(等待资源的进程数)和wa参数(IO等待所占用的CPU时间的百分比,高过30%时IO压力高)。
从这一步观察到,磁盘每隔一段时间,%util就会冲到100%,明显的io瓶颈。
iostat -xmt 1

如果%iowait的值过高,表示硬盘存在I/O瓶颈。
如果 %util 接近 100%,说明产生的I/O请求太多,I/O系统已经满负荷,该磁盘可能存在瓶颈。
如果 svctm 比较接近 await,说明 I/O 几乎没有等待时间;
如果 await 远大于 svctm,说明I/O 队列太长,io响应太慢,则需要进行必要优化。
如果avgqu-sz比较大,也表示有大量io在等待。
Xserver ➜  ~  iostat -xmt 1
Device:         rrqm/s   wrqm/s     r/s     w/s    rMB/s    wMB/s avgrq-sz avgqu-sz   await r_await w_await  svctm  %util
sdc               0.00     4.00 12075.00   32.00   111.14     6.71    19.94     1.73    0.14    0.14    1.28   0.08  92.60
sda               0.00     0.00 16123.00   20.00   128.41     0.01    16.29     2.78    0.17    0.17    0.45   0.06  99.80
sdb               0.00     0.00 5583.00   10.00    65.36     0.00    23.93     0.77    0.14    0.14    0.20   0.14  76.70
dm-0              0.00     0.00 33781.00   36.00   304.91     6.73    18.87     5.28    0.16    0.15    1.42   0.03 100.00

10/20/2016 11:23:29 AM
avg-cpu:  %user   %nice %system %iowait  %steal   %idle
          26.53    0.13    5.99   40.82    0.00   26.53

Device:         rrqm/s   wrqm/s     r/s     w/s    rMB/s    wMB/s avgrq-sz avgqu-sz   await r_await w_await  svctm  %util
sdc               0.00     3.00 11610.00   30.00   110.26     6.12    20.48     1.74    0.15    0.15    1.03   0.08  92.40
sda               0.00     0.00 15675.00   18.00   125.81     0.01    16.42     2.76    0.18    0.18    0.50   0.06  99.90
sdb               0.00     0.00 5585.00    9.00    65.66     0.00    24.04     0.76    0.14    0.14    0.33   0.14  76.20
dm-0              0.00     0.00 32870.00   33.00   301.73     6.13    19.16     5.28    0.16    0.16    1.15   0.03 100.00

Device:         rrqm/s   wrqm/s     r/s     w/s    rMB/s    wMB/s avgrq-sz avgqu-sz   await r_await w_await  svctm  %util
sdc            5376.00     0.00 7036.00  114.00    93.71    45.92    39.99     3.46    0.47    0.36    7.18   0.13  89.80
sda               0.00     0.00 2163.00   18.00    24.90     0.02    23.40     0.39    0.18    0.18    0.39   0.18  38.30
sdb               0.00     0.00 4871.00    9.00    52.70     0.00    22.12     0.38    0.08    0.08    0.11   0.08  38.30
dm-0              0.00     0.00 12873.00  116.00   142.84    46.90    29.92     2.96    0.22    0.16    7.09   0.07  92.80
至此,系统基本信息应该都搜罗完毕。
从硬件上看到的问题有CPU轻微负载,内存占用基本饱和,磁盘读需求偶尔增大甚至满负荷,但是都符合服务器使用预期,为什么会导致硬件这样,需要挖掘更深层次的原因。接下来需要对整体系统做个检查。用到vmstat,这是个很全面的性能分析工具:
vmstat 1 5
Xserver ➜  ~  vmstat 1 5
procs -----------memory---------- ---swap-- -----io---- -system-- ------cpu-----
 r  b   swpd   free   buff  cache   si   so    bi    bo   in   cs us sy id wa st
 3  0 2927676 239272      0 4161200    0    0 253600     0 33082 68014 32  4 39 24  0
 6  5 2927676 246232      0 4156132    0    0 178032   148 24232 51846 26  3 55 15  0
 3  6 2927676 243488      0 4158640    0    0 395144  1463 50294 107016 37  7 23 33  0
 2  0 2927676 238808      0 4163788    0    0 319572     0 40892 281330 35  7 32 27  0
 1  0 2927676 229300      0 4171632    0    0 15040     0 4399 8406 17  1 81  1  0
 1  0 2927676 246300      0 4153080    0    0 10748    24 4201 8248 17  1 81  1  0
 6  4 2927676 218224      0 4182032    0    0 222500  1247 30467 59984 43  5 37 15  0
 3  6 2927676 235192      0 4167588    0    0 370404   132 46222 98108 38  6 26 30  0
 3  5 2927676 238712      0 4163012    0    0 362996   848 46656 97677 45  6 23 26  0
 6  4 2927676 239300      0 4162448    0    0 374868   264 46400 98529 31  7 19 43  0
 1  0 2956900 227140      0 3977912    0    0  8852    46 3968 7152 16  1 83  0  0
15  6 2956900 245184      0 3927188    0    0 37276   183 8578 13843 31  2 67  1  0
8  5 2956900 236308      0 3935400    0    0 275412    97 35331 69785 45  6 29 21  0
4  5 2956900 225864      0 3948132    0    0 410908     0 48407 104260 35  7 22 37  0
3  6 2956900 242680      0 3933344    0    0 436792     0 50931 109695 34  7 22 37  0
procs -----------memory---------- ---swap-- -----io---- -system-- ------cpu-----
 r  b   swpd   free   buff  cache   si   so    bi    bo   in   cs us sy id wa st
 8  5 2956656 237644      0 3994528    0    0 32604    52 7246 10961 23  1 76  0  0
 5  7 2956656 230136      0 4004496    0    0 422948    63 50258 106577 37  7 21 36  0
 5  4 2956656 232864      0 4003764    0    0 430756     0 50927 106448 33  7 18 43  0
 3  8 2956656 241628      0 3994684    0    0 396892   205 46882 98746 32  7 18 43  0
 14  5 2927720 239080      0 4147780    0    0 182728   963 25122 52297 38  4 43 15  0
 1  8 2956656 236160      0 4001968    0    0 358676     0 43296 95675 31  6 22 41  0
 9  2 2647292 224476      0 3916116  246   94  3209   520    1    2  5  1 90  3  0
11  2 2647288 237896      0 3904792    4    0 101336 112727 25439 43526 80  4  8  8  0
11  3 2647288 234336      0 3908044    0    0 98620 127144 26045 42330 75  5 10 11  0
10  4 2647288 242492      0 3896796    0    0 82532 280280 25998 40454 79  5  8  8  0
12  1 2647288 231756      0 3907712    0    0 92368 28028 21501 40764 83  3  8  6  0
 8  0 2647284 223204      0 3916180    0    0 94044 10644 24150 49227 79  3 14  3  0
第一列procs的r列 代表运行和等待CPU时间片的进程数,这个值如果长期大于系统CPU个数,就说明CPU资源不足,可以考虑增加CPU。
第二列procs的b列 代表在等待资源的进程数,比如正在等待I/O或者内存交换等。
我们的服务器CPU是4核,从数值上看CPU有一定负载。使用高峰期甚至有3倍的负荷。 但是即使这样也不能草率的断定是CPU处理能力不足,应该拉长观察周期,看看这种负荷是否连续几天都发生,负荷是暂时的还是已经是常态。
完成CPU使用分析后,跟踪vmstat的memory部分:
swpd 表示切换到内存交换区的内存数量(以KB为单位)。如果swpd的值不为0或者比较大,而且si、so的值长期为0,那么这种情况一般不用担心,不会影响系统性能。si列表示由磁盘调入内存,也就是内存进入内存交换区的数量。so列表示由内存调入磁盘,也就是内存交换区进入内存的数量。一般情况下,si、so的值都为0,如果si、so的值长期不为0,则表示系统内存不足,需要考虑是否增加系统内存。从我们的实际情况看来,前后在不同的时间统计了两次第一次 SWAP虽然利用率不高,但是si长期处于0~50状态。 但是在第二次观察过程中 si偶尔冲到200~300。
cache 列表示page cached的内存数量,一般作文件系统的cached,频繁访问的文件都会被cached。如果cached值较大,就说明cached文件数较多。如果此时IO中的bi比较小,就说明文件系统效率比较好。如果cache的值大的时候,说明cache处的文件数多,如果频繁访问到的文件都能被cache处,那么磁盘的读IO bi(每秒读取的块数)会非常小。bi+bo参考值为1000,如果超过1000,而且wa值比较大,则表示系统磁盘IO性能瓶颈。可以看出 我们的cache量很大,但是文件系统利用率不高,bi读的略高频,磁盘IO性能有可能存在问题。但是仔细想一下,出现这种情况和MongoDB工作机制有关联,后续详述。
之后是system部分:
in列表示在某一时间间隔中观察到的每秒设备中断数;cs列表示每秒产生的上下文切换次数。
上面这两个值越大,会看到内核消耗的CPU时间就越多。
最后的CPU部分:
us列显示了用户进程消耗CPU的时间百分比。us的值比较高时,说明用户进程消耗的CPU时间多,如果长期大于50%,需要考虑优化程序啥的。sy列显示了内核进程消耗CPU的时间百分比。sy的值比较高时,就说明内核消耗的CPU时间多;如果us+sy超过80%,就说明CPU的资源存在不足。id列显示了CPU处在空闲状态的时间百分比;wa列表示IO等待所占的CPU时间百分比。wa值越高,说明IO等待越严重。如果wa值超过20%,说明IO等待严重。
通过vmstat分析可以看出 整个系统的io等待消耗略高
总结一下
经过首轮针对系统性能的调研,目前可以发现:
- 不同时间段CPU负载时高时低,可能由于使用场景负载值表现不稳定
- 从磁盘调用到内存的操作频繁,cache一直在work,IO消耗明显
cache的量很大,但是cache的利用率却不高- 常驻内存程序较多,有个锁的问题
- 整个系统的IO等待消耗略高
根据这个结论想下去,有这样一个可能,这个可能也符合我们的使用这台机器的场景,不同的人,一直在做不同的查询,又由于MongoDB的内存机制,不断的cache不同的结果到内存,造成IO。所以如果说慢,慢到MongoBD本身,MongoDB一直拼命的查查查,前面cache了一笔数据到内存,后面的却用不着,又要去查查查,又是一次IO消耗。
MongoDB优化部分
那么MongoDB到底在做什么,有没有优化的可能。
1. 谁在做查询
首先会关心,到底MongoDB在忙啥。db.currentOP()可以看出当前Mongo内的查询。应该分别抽样使用高峰期和日常情况比对OP结果。
db.currentOP()
高峰期实际执行效果,惊讶的发现同时有十几个查询,很明显这么多查询让Mongo一直处于高耗状态。回到日常相互对比,重点关注lockStats字段,高峰期的锁时常是日常的几倍:
> db.currentOP()
"lockStats" : {
    "Global" : {
        "acquireCount" : {
            "r" : NumberLong(162154)
        }
    },
    "Database" : {
        "acquireCount" : {
            "r" : NumberLong(81077)
        }
    },
    "Collection" : {
        "acquireCount" : {
            "r" : NumberLong(81077)
        }
    }
}
......
2. 揪出慢查询
MongoDB自带了一个慢查询分析工具,可以针对性的分析某个数据库,某个条查询。默认情况下是关闭的。
db.getProfilling()
db.setProfilingLevel(level, slowms)
结合db.currentOP()和mongostat/mongotop已经可以判断查询消耗到哪个数据库,接下来就是切进某个库去看究竟承受哪些慢查询,统计查询消耗大于200毫秒的信息:
use db_you_want_to_profile
db.setProfilingLevel(1, 200)
完成设置后,当前数据库下会产生一个system.profile表,里面会收集慢查询数据。只是万万没想到,一天内收集了677条慢查询。接下来分析这些慢查询的共同点,试图找些答案。
这一天的慢查询几乎都来自一个表eventV4:
db.system.profile.find({"ns":"eventsV4.eventV4"}).count() //674
抽样对比分析eventV4和其它表分析时候到底哪里不同,发现locks明显大好多(5000~20000),猜测可能是 r锁堆积,导致查询缓慢:
/* 1 eventV4 */
{
    "locks" : {
        "Global" : {
            "acquireCount" : {
                "r" : NumberLong(32794)
            }
        },
        "Database" : {
            "acquireCount" : {
                "r" : NumberLong(16397)
            }
        },
        "Collection" : {
            "acquireCount" : {
                "r" : NumberLong(16397)
            }
        }
    }
}

/* 2 同库下的其它表 */
{
    "locks" : {
        "Global" : {
            "acquireCount" : {
                "r" : NumberLong(4)
            }
        },
        "Database" : {
            "acquireCount" : {
                "r" : NumberLong(2)
            }
        },
        "Collection" : {
            "acquireCount" : {
                "r" : NumberLong(2)
            }
        }
    }
}

// 同库,未建索引表,数据量小于eventV4
"locks" : {
    "Global" : {
        "acquireCount" : {
            "r" : NumberLong(6534)
        }
    },
    "Database" : {
        "acquireCount" : {
            "r" : NumberLong(3267)
        }
    },
    "Collection" : {
        "acquireCount" : {
            "r" : NumberLong(3267)
        }
    }
}
对比推测肯定是跟数据量有关系,数据量越大,mongo扫描表时间越长,产生的locks时间越长。想理解locks,有必要读懂整个profile记录了些什么,目前发现的每条慢查询,都卡在等待的锁上。等待的锁干了什么?google了一番:
锁的机制: 在执行读操作之前,MongoDB会监测内存,预测数据是否存在在内存里,如果MongoDB监测到数据不存在,读操作会在MongoDB从磁盘数据文件加载数据到内存过程中释放锁,当数据全部加载完成,它会重新去获取锁完成操作。

MongoDB uses a locking system to ensure data set consistency. If certain operations are long-running or a queue forms, performance will degrade as requests and operations wait for the lock.
locks值一直偏高,可能是因为mongo一直在做大量数据的cache。抽样慢查询继续解读,证明这个猜想:
{
    "op" : "query",   //操作类型,有insert、query、update、remove、getmore、command
    "ns" : "eventsV4.eventV4", // 操作的Collection
    "query" : {                 // query的语句,如果语句太长,就会省略显示
        "find" : "eventV4",
        "filter" : {
            "eventKey" : "clickBPBind",
            "os" : "android"
        }
    },
    "keysExamined" : 63594, // 为了完成该次需求,查询的键的次数
    "docsExamined" : 63594, // 为了完成该次需求,查询文档的数量
    "cursorExhausted" : true,
    "keyUpdates" : 0,
    "writeConflicts" : 0,
    "numYield" : 657, // 该操作为了使其他操作完成而放弃的次数。通常来说,当他们需要访问还没有完全读入内存中的数据时,操作将放弃。这使得在MongoDB为了放弃操作进行数据读取的同时,还有数据在内存中的其他操作可以完成
    "locks" : { //锁信息,R:全局读锁;W:全局写锁;r:特定数据库的读锁;w:特定数据库的写锁,为了等待查询,锁等待时间
        "Global" : {
            "acquireCount" : {
                "r" : NumberLong(1316)
            }
        },
        "Database" : {
            "acquireCount" : {
                "r" : NumberLong(658)
            }
        },
        "Collection" : {
            "acquireCount" : {
                "r" : NumberLong(658)
            }
        }
    },
    "nreturned" : 0,  // 返回的文档数量
    "responseLength" : 107, // 返回字节长度,如果这个数字很大,考虑值返回所需字段
    "protocol" : "op_command",
    "millis" : 12761,
    "execStats" : {
        "stage" : "FETCH", //  根据索引去检索指定document
        "filter" : {
            "os" : {
                "$eq" : "android"
            }
        },
        "nReturned" : 0,
        "executionTimeMillisEstimate" : 12672,
        "works" : 63595,
        "advanced" : 0,
        "needTime" : 63594,
        "needYield" : 0,
        "saveState" : 657,
        "restoreState" : 657,
        "isEOF" : 1,
        "invalidates" : 0,
        "docsExamined" : 63594,
        "alreadyHasObj" : 0,
        "inputStage" : {
            "stage" : "IXSCAN",
            "nReturned" : 63594,
            "executionTimeMillisEstimate" : 121,
            "works" : 63595,
            "advanced" : 63594,
            "needTime" : 0,
            "needYield" : 0,
            "saveState" : 657,
            "restoreState" : 657,
            "isEOF" : 1,
            "invalidates" : 0,
            "keyPattern" : {
                "eventKey" : 1
            },
            "indexName" : "eventKey_1",
            "isMultiKey" : false,
            "isUnique" : false,
            "isSparse" : false,
            "isPartial" : false,
            "indexVersion" : 1,
            "direction" : "forward",
            "indexBounds" : {
                "eventKey" : [
                    "[\"clickBPBind\", \"clickBPBind\"]"
                ]
            },
            "keysExamined" : 63594,
            "dupsTested" : 0,
            "dupsDropped" : 0,
            "seenInvalidated" : 0
        }
    },
    "ts" : ISODate("2016-10-19T05:54:57.799Z"),
    "client" : "10.8.2.238",
    "allUsers" : [],
    "user" : ""
}


/* 1 */
{
    "op" : "query",
    "ns" : "eventsV4.httplogs",
    "query" : {
        "find" : "httplogs",
        "filter" : {
            "url" : {
                "$regex" : /\/login\/qq$/
            },
            "status" : {
                "$regex" : /2\\d\\d/
            },
            "method" : "POST"
        }
    },
    "cursorid" : NumberLong(9075168688697),
    "keysExamined" : 0,
    "docsExamined" : 19793,  //扫描了<2w条
    "keyUpdates" : 0,
    "writeConflicts" : 0,
    "numYield" : 173,
    "locks" : {
        "Global" : {
            "acquireCount" : {
                "r" : NumberLong(348)
            }
        },
        "Database" : {
            "acquireCount" : {
                "r" : NumberLong(174)
            }
        },
        "Collection" : {
            "acquireCount" : {
                "r" : NumberLong(174)
            }
        }
    },
    "nreturned" : 101,      //只返回101
    "responseLength" : 256550,
    "millis" : 1978,
    "execStats" : {
        "stage" : "COLLSCAN",
        "filter" : {
            "$and" : [
                {
                    "method" : {
                        "$eq" : "POST"
                    }
                },
                {
                    "status" : /2\\d\\d/
                },
                {
                    "url" : /\/login\/qq$/
                }
            ]
        },
        "nReturned" : 101,
        "executionTimeMillisEstimate" : 1926,
        "works" : 19794,
        "advanced" : 101,
        "needTime" : 19693,
        "needYield" : 0,
        "saveState" : 174,
        "restoreState" : 173,
        "isEOF" : 0,
        "invalidates" : 0,
        "direction" : "forward",
        "docsExamined" : 19793
    },
    "ts" : ISODate("2016-10-20T00:32:01.730Z"),
    "client" : "127.0.0.1",
    "allUsers" : [],
    "user" : ""
}
注意到上面的慢查询keysExamined、docsExamined的值如果较大,原因是没有用到索引查询,而是全表扫描。keysExamined、docsExamined的值大于nreturned的值,说明为了找到目标文档,扫描了很多文档。解决办法是考虑如何用索引来减少全表查询。
综上结果,慢查询可能的两个原因是:1. 等待锁 2. 全表扫描。两个问题相互影响,没有索引的情况mongo开始全表扫描,扫描占用cursor,后续的任务加锁等待。
推荐读一下这篇文章,了解read locks http://stackoverflow.com/questions/23893432/mongodb-read-locks
关于锁机制 https://docs.mongodb.com/manual/faq/concurrency/
read locks会在哪些操作下产生?https://docs.mongodb.com/manual/faq/concurrency/#which-operations-lock-the-database
基于上面的假设,看看有没有其他参数可以辅助说明这堆慢查询到底哪里影响到了性能,用db.serverStatus()继续观察:
> db.serverStatus().extra_info
{
		"note" : "fields vary by platform",
		"heap_usage_bytes" : -612368944,
		"page_faults" : 4018685 //注意到page fault特别多,Page faults refer to operations that require the database server to access data which isn’t available in active memory.
}
// 由page fault反应出了高IO

> db.serverStatus().wiredTiger
{
	"uri" : "statistics:",
	"LSM" : {
		"application work units currently queued" : 0,
		"merge work units currently queued" : 0,
		"rows merged in an LSM tree" : 0,
		"sleep for LSM checkpoint throttle" : 0,
		"sleep for LSM merge throttle" : 0,
		"switch work units currently queued" : 0,
		"tree maintenance operations discarded" : 0,
		"tree maintenance operations executed" : 0,
		"tree maintenance operations scheduled" : 0,
		"tree queue hit maximum" : 0
	},
	"async" : {
		"current work queue length" : 0,
		"maximum work queue length" : 0,
		"number of allocation state races" : 0,
		"number of flush calls" : 0,
		"number of operation slots viewed for allocation" : 0,
		"number of times operation allocation failed" : 0,
		"number of times worker found no work" : 0,
		"total allocations" : 0,
		"total compact calls" : 0,
		"total insert calls" : 0,
		"total remove calls" : 0,
		"total search calls" : 0,
		"total update calls" : 0
	},
	"block-manager" : {
		"blocks pre-loaded" : 60795,
		"blocks read" : 6155993572,
		"blocks written" : 314396778,
		"bytes read" : NumberLong("65017990504448"),
		"bytes written" : NumberLong("3637093871616"),
		"mapped blocks read" : 0,
		"mapped bytes read" : 0
	},
	"cache" : {
		"bytes currently in the cache" : 16304875706,
		"bytes read into cache" : NumberLong("163135704489559"),
		"bytes written from cache" : NumberLong("5632021939447"),
		"checkpoint blocked page eviction" : 1378178,
		"eviction currently operating in aggressive mode" : 0,
		"eviction server candidate queue empty when topping up" : 4456413,
		"eviction server candidate queue not empty when topping up" : 95383836,
		"eviction server evicting pages" : 0,
		"eviction server populating queue, but not evicting pages" : 99840247,
		"eviction server unable to reach eviction goal" : 6,
		"eviction worker thread evicting pages" : 6362773163,
		"failed eviction of pages that exceeded the in-memory maximum" : 53246,
		"hazard pointer blocked page eviction" : 221745520,
		"in-memory page passed criteria to be split" : 845450,
		"in-memory page splits" : 373374,
		"internal pages evicted" : 50099839,
		"internal pages split during eviction" : 7612,
		"leaf pages split during eviction" : 1577344,
		"lookaside table insert calls" : 17424,
		"lookaside table remove calls" : 17424,
		"maximum bytes configured" : 19327352832,
		"maximum page size at eviction" : 162056020,
		"modified pages evicted" : 193796965,
		"page split during eviction deepened the tree" : 416,
		"page written requiring lookaside records" : 100,
		"pages currently held in the cache" : 603200,
		"pages evicted because they exceeded the in-memory maximum" : 12512,
		"pages evicted because they had chains of deleted items" : 435755,
		"pages evicted by application threads" : 13801519,
		"pages read into cache" : 6155852884,
		"pages read into cache requiring lookaside entries" : 346,
		"pages selected for eviction unable to be evicted" : 226204522,
		"pages walked for eviction" : NumberLong("7595188070651"),
		"pages written from cache" : 314110934,
		"pages written requiring in-memory restoration" : 0,
		"percentage overhead" : 8,
		"tracked bytes belonging to internal pages in the cache" : 850141371,
		"tracked bytes belonging to leaf pages in the cache" : 15454734335,
		"tracked bytes belonging to overflow pages in the cache" : 0,
		"tracked dirty bytes in the cache" : 192334903,
		"tracked dirty pages in the cache" : 7557,
		"unmodified pages evicted" : 5956696443
	},
	"connection" : {
		"auto adjusting condition resets" : 2255111,
		"auto adjusting condition wait calls" : 8436431,
		"files currently open" : 296,
		"memory allocations" : 54944049924,
		"memory frees" : 54928245812,
		"memory re-allocations" : 11210151,
		"pthread mutex condition wait calls" : 854008508,
		"pthread mutex shared lock read-lock calls" : 25895875,
		"pthread mutex shared lock write-lock calls" : 16392843,
		"total read I/Os" : 6156016152,
		"total write I/Os" : 330524211
	},
	"cursor" : {
		"cursor create calls" : 522065,
		"cursor insert calls" : 7830631208,
		"cursor next calls" : 263324152423,
		"cursor prev calls" : 679231937,
		"cursor remove calls" : 636744308,
		"cursor reset calls" : 11754924787,
		"cursor restarted searches" : 67854503,
		"cursor search calls" : 23861770131,
		"cursor search near calls" : 11938963480,
		"cursor update calls" : 0,
		"truncate calls" : 12432
	},
	"data-handle" : {
		"connection data handles currently active" : 294,
		"connection sweep candidate became referenced" : 0,
		"connection sweep dhandles closed" : 4421,
		"connection sweep dhandles removed from hash list" : 7191639,
		"connection sweep time-of-death sets" : 7207657,
		"connection sweeps" : 204054,
		"session dhandles swept" : 850952,
		"session sweep attempts" : 98718
	},
	"log" : {
		"busy returns attempting to switch slots" : 12388445,
		"consolidated slot closures" : 16088029,
		"consolidated slot join races" : 67219727906,
		"consolidated slot join transitions" : 16088029,
		"consolidated slot joins" : 1941081336,
		"consolidated slot unbuffered writes" : 11921,
		"log bytes of payload data" : NumberLong("1682968712788"),
		"log bytes written" : NumberLong("1803074414208"),
		"log files manually zero-filled" : 0,
		"log flush operations" : 20241377,
		"log force write operations" : 7032057539,
		"log force write operations skipped" : 7028697836,
		"log records compressed" : 1168449464,
		"log records not compressed" : 451788336,
		"log records too small to compress" : 320841310,
		"log release advances write LSN" : 23779,
		"log scan operations" : 3,
		"log scan records requiring two reads" : 4,
		"log server thread advances write LSN" : 15907793,
		"log server thread write LSN walk skipped" : 129354646,
		"log sync operations" : 1474618,
		"log sync_dir operations" : 17072,
		"log write operations" : 1941078552,
		"logging bytes consolidated" : NumberLong("1803075289600"),
		"maximum log file size" : 104857600,
		"number of pre-allocated log files to create" : 41,
		"pre-allocated log files not ready and missed" : 40,
		"pre-allocated log files prepared" : 17230,
		"pre-allocated log files used" : 17189,
		"records processed by log scan" : 10,
		"total in-memory size of compressed records" : NumberLong("2888419721273"),
		"total log buffer size" : 33554432,
		"total size of compressed records" : NumberLong("1468710608377"),
		"written slots coalesced" : 156456,
		"yields waiting for previous log file close" : 68293966
	},
	"reconciliation" : {
		"fast-path pages deleted" : 22,
		"page reconciliation calls" : 201630886,
		"page reconciliation calls for eviction" : 172716774,
		"pages deleted" : 545055,
		"split bytes currently awaiting free" : 12206,
		"split objects currently awaiting free" : 13
	},
	"session" : {
		"open cursor count" : 140,
		"open session count" : 27
	},
	"thread-yield" : {
		"page acquire busy blocked" : 90980,
		"page acquire eviction blocked" : 71022,
		"page acquire locked blocked" : 138605519,
		"page acquire read blocked" : 80706355190,
		"page acquire time sleeping (usecs)" : 410545187000
	},
	"transaction" : {
		"number of named snapshots created" : 0,
		"number of named snapshots dropped" : 0,
		"transaction begins" : 4315771680,
		"transaction checkpoint currently running" : 0,
		"transaction checkpoint generation" : 33888,
		"transaction checkpoint max time (msecs)" : 488189,
		"transaction checkpoint min time (msecs)" : 6,
		"transaction checkpoint most recent time (msecs)" : 2184,
		"transaction checkpoint total time (msecs)" : 7407636,
		"transaction checkpoints" : 33888,
		"transaction failures due to cache overflow" : 0,
		"transaction range of IDs currently pinned" : 16,
		"transaction range of IDs currently pinned by a checkpoint" : 0,
		"transaction range of IDs currently pinned by named snapshots" : 0,
		"transaction sync calls" : 0,
		"transactions committed" : 1942468113,
		"transactions rolled back" : 2373307543
	},
	"concurrentTransactions" : {
		"write" : {
			"out" : 2,
			"available" : 126,
			"totalTickets" : 128
		},
		"read" : {
			"out" : 1,
			"available" : 127,
			"totalTickets" : 128
		}
	}
}
>
观察serverStatus可以看出cache的利用率真的不高,tracked dirty bytes in the cache值偏高,这个可以通过增加cache提高性能。当全面扫描过程中一直在做cache,但是命中的文档却很少,导致dirty cache值拉高。然后注意到下面值:
    "bytes currently in the cache" : 16304875706,  // Size in byte of the data currently in cache, 这个值应该小于`maximum bytes configured`
    "tracked dirty bytes in the cache" : 192334903,  //代表cache中的脏数据, 按照官方文档说法`Size in bytes of the dirty data in the cache. This value should be less than the bytes currently in the cache value.`,
    "maximum bytes configured" : 19327352832,  // 默认19GB
可以尝试增加cache,参考这里,尝试的一个治标不治本的解决思路是 既然由于表document太多,需要做的cache太多,增加cache size,加快这个cache过程:
db.adminCommand( { "setParameter": 1, "wiredTigerEngineRuntimeConfig": "cache_size=30G"})

// 实际执行效果
> db.adminCommand( { "setParameter": 1, "wiredTigerEngineRuntimeConfig": "cache_size=30G"})  // 一定延时
{ "was" : "", "ok" : 1 }
但是这样设置有副作用,如果发现mongoDB意外终止,不排除是内存溢出后系统kill mongod进程,检查办法:
 # 如果被系统干掉会留下日志
 # ref1: https://jira.mongodb.org/browse/SERVER-22000
 # ref2: http://serverfault.com/questions/537176/mongodb-getting-oom-killed
 sudo tail -n 500 ./messages | mongo
4. 查询/配置优化
以往的数据量级也差不多,为什么eventV4特别卡,反思一下有可能是文档结构导致的。过去的表结构比较统一,新的表结构不再可控,文档长度参差,Key不是很统一,有的字段只有部分document才会有,可是查询却会用的着,每次查询这种随机字段意味着一次全表扫描。这就搞笑了,随着数据规模增长,这是特性还是BUG? 从建索引角度出发,我们有必要针对一些经常需要查询的随机字段做稀疏索引。
db.eventV4.createIndex( { "u_name": 1 }, { sparse: true } )
硬件上的优化办法肯定是CPU加核 + SSD(WT引擎官方推荐ext4) + 大内存(尽可能减免磁盘IO),但是我们目前服务器硬件升级基本已经加到极限,未来要么升级专业的服务器,要么考虑如何分片。
软优化办法就是建立各种索引,防止全表遍历。理想情况是 索引覆盖查询。我们的实际生产环境中,索引比较混乱,存在一些重复的索引,实际上目前所有的组合索引可以包含单个索引,有些单个索引可以drop了。比如有一个组合索引 {"u_name":1, "device":1},是没必要建立 {"device":1} 这个索引了。有些需要用到regex query的字段,最好覆盖索引,加快查询,如果没有命中索引代价是从头开始匹配。
从文档结构上讲,应该适度的避开扁平结构。比如这样一条文档:
{
    "_id" : ObjectId("57d5f5e380213a12111100fb"),
    "device" : "862007031225925",
    "uuid" : "c7746de1-cf10-4009-bf77-ef04216725a0",
    "d_model_brand" : "m3 note",
    "os" : "android",
    "d_model_name" : "Meizu",
    "d_os_version" : "5.1",
    "eventKey" : "initApp",
    "platform" : "app",
    "category" : "site",
    "role" : "visitor",
    "d_os_name" : "android",
    "eventTime" : 1473558565985,
    "netConfig" : "wifi",
    "channel" : "guanghetv",
    "d_appVersion" : "2.9.0",
    "ua" : "Dalvik/2.1.0 (Linux; U; Android 5.1; m3 note Build/LMY47I)",
    "ip" : "27.189.204.34",
    "location" : "河北省廊坊市",
    "__v" : 0
}
我们想找出所有这个手机品牌:
db.eventV4.find({"d_model_brand" : "m3 note"})
MongoDB会遍历整条document去找d_model_brand,挨个去找_id -> device -> uuid -> d_model_brand。但如果我们调整一下文档结构:
{
    "_id" : ObjectId("57d5f5e380213a12111100fb"),
    "uuid" : "c7746de1-cf10-4009-bf77-ef04216725a0",
    "device" : {
        "d_id": "862007031225925",
        "d_model_brand" : "m3 note",
        "os" : "android",
        "d_model_name" : "Meizu",
        "d_os_version" : "5.1",
    },
    "eventKey" : "initApp",
    "platform" : "app",
    "category" : "site",
    "role" : "visitor",
    "d_os_name" : "android",
    "eventTime" : 1473558565985,
    "netConfig" : "wifi",
    "channel" : "guanghetv",
    "d_appVersion" : "2.9.0",
    "ua" : "Dalvik/2.1.0 (Linux; U; Android 5.1; m3 note Build/LMY47I)",
    "ip" : "27.189.204.34",
    "location" : "河北省廊坊市",
    "__v" : 0
}
MongoDB的遍历过程就成了_id -> uuid -> device.d_model_name,我们可以合理的使用层次让Mongo减少字段的扫描。
在实际的使用场景中,如果遇到日期、日期范围查询,可以考虑直接使用Mongo的ObjectId(),天然索引,查询超快:
> ObjectId("57d5f5e380213a12111100fb").getTimestamp()
ISODate("2016-09-12T00:25:07Z")
如果去find相同的一条文档,看explain会发现(组织查询前先尝试一把explain看返回各个参数斟酌查询如何组织),查询_id的情况下只过了一层stage: IDHACK,查询一个索引字段经历了两层stage:
db.eventV4.find({"_id": ObjectId("58096095822397568617a190") }).explain()
// "winningPlan" : {
//      "stage" : "IDHACK"
//  }
db.eventV4.find({"serverTime" : ISODate("2016-10-20T14:28:42.756Z") }).explain()
// "winningPlan" : {
//     "stage" : "FETCH",
//     "inputStage" : {
//         "stage" : "IXSCAN",
//         ......
//         "direction" : "forward",
//         "indexBounds" : {
//             "serverTime" : [
//                 "[new Date(1476973722756), new Date(1476973722756)]"
//             ]
//         }
//     }
// }
当然explain()返回不止这些,需要关注的点有耗时多少,是否有index覆盖,document扫描数和返回数。
还有一个mongo配置上的尝试,就是在mongo登录的时候会看到:
Xserver ➜  ~  mongo
MongoDB shell version: 3.2.6
connecting to: test
Server has startup warnings:
2016-09-26T17:18:46.477+0800 I CONTROL  [initandlisten]
2016-09-26T17:18:46.477+0800 I CONTROL  [initandlisten] ** WARNING: /sys/kernel/mm/transparent_hugepage/enabled is 'always'.
2016-09-26T17:18:46.477+0800 I CONTROL  [initandlisten] **        We suggest setting it to 'never'
2016-09-26T17:18:46.477+0800 I CONTROL  [initandlisten]
2016-09-26T17:18:46.477+0800 I CONTROL  [initandlisten] ** WARNING: /sys/kernel/mm/transparent_hugepage/defrag is 'always'.
2016-09-26T17:18:46.477+0800 I CONTROL  [initandlisten] **        We suggest setting it to 'never'
2016-09-26T17:18:46.477+0800 I CONTROL  [initandlisten]
>
transparent_hugepage什么鬼,为什么建议关闭,这会影响到性能吗?答案是会的。transparent_hugepage可能占用内存,甚至会导致内存泄露。Hugepage导致进程占用物理内存过多的问题有人做过测试。 Transparent Hugepage是由Andrea Arcangeli提交并在2.6.38合到内核的特性,这对于使用大内存的程序,可以减少TLB miss的次数,据说能带来10%的性能提升。但是,由于PAGE size变成2M,这也可能带来负面的影响,可能导致程序占用的物理内存比4K的page size情况下要多。当然,前提是程序申请了过多的内存,却没有使用到这些内存。 放到MongoDB里,数据库的内存申请模式偏向于更稀疏的方式去申请,而不是一次要一大块儿,禁用的好处是可能换来让Mongo可以合理使用内存。具体设置办法,官方文档已经给出指导:
# step.1 Create a new tuned profile directory:
Xserver ➜  ~  sudo mkdir /etc/tuned/no-thp
[sudo] password for master:

# step.2 Create and edit /etc/tuned/no-thp/tuned.conf so that it contains the following:
Xserver ➜  ~  cat /etc/tuned/no-thp/tuned.conf
[main]
include=virtual-guest

[vm]
transparent_hugepages=never

# step.3 Finally, enable the new profile by issuing:
Xserver ➜  ~  sudo tuned-adm profile no-thp
理想效果是cat /sys/kernel/mm/transparent_hugepage/里面的的enable/defrag里的never都变成[never],但实际执行效果是:
Xserver ➜  ~  cat /sys/kernel/mm/transparent_hugepage/enabled
always madvise [never]
Xserver ➜  ~  cat /sys/kernel/mm/transparent_hugepage/defrag
[always] madvise never

# 被官方文档欺骗了 T——T
好吧,tuned无效,还有官方的另一个写脚本的办法:
# 创建init.d脚本
Xserver ➜  ~  cat /etc/init.d/disable-transparent-hugepages
#!/bin/bash
### BEGIN INIT INFO
# Provides:          disable-transparent-hugepages
# Required-Start:    $local_fs
# Required-Stop:
# X-Start-Before:    mongod mongodb-mms-automation-agent
# Default-Start:     2 3 4 5
# Default-Stop:      0 1 6
# Short-Description: Disable Linux transparent huge pages
# Description:       Disable Linux transparent huge pages, to improve
#                    database performance.
### END INIT INFO

case $1 in
  start)
    if [ -d /sys/kernel/mm/transparent_hugepage ]; then
      thp_path=/sys/kernel/mm/transparent_hugepage
    elif [ -d /sys/kernel/mm/redhat_transparent_hugepage ]; then
      thp_path=/sys/kernel/mm/redhat_transparent_hugepage
    else
      return 0
    fi

    echo 'never' > ${thp_path}/enabled
    echo 'never' > ${thp_path}/defrag

    re='^[0-1]+$'
    if [[ $(cat ${thp_path}/khugepaged/defrag) =~ $re ]]
    then
      # RHEL 7
      echo 0  > ${thp_path}/khugepaged/defrag
    else
      # RHEL 6
      echo 'no' > ${thp_path}/khugepaged/defrag
    fi

    unset re
    unset thp_path
    ;;
esac

# 增加可执行权限
Xserver ➜  ~  sudo chmod 755 /etc/init.d/disable-transparent-hugepages

# 设置该脚本开机启动
Xserver ➜  ~  sudo chkconfig --add disable-transparent-hugepages

# 重启系统看效果,实际效果应该可以反映到内存占用上,如果内存占用降低,说明有效
5. 官方白皮书
MongoDB官方提供了一本性能优化最佳实践白皮书(12页) Performance Best Practices for MongoDB
这份guide讨论了最佳设计模式、索引优化、磁盘优化、在 Amazon EC2 最佳实践和压测等。跟着文档走能尽可能优化MongoDB,网上能搜得着的优化建议应该都出自这里,头条就说必须要working set fits in RAM。有一个有意思的优化建议是设置getahead,这个参数控制着预读磁盘的大小,如果读取数据大小远小于磁盘的预读大小,对内存会造成不必要的消耗,而且还浪费了数据的读取时间,当MongoDB随机读取数据的时候,读取时候合适的块大小可以提高性能,官方建议将这个预读块大小设置成32(16kb):
首先我检查了一下我们的默认块大小是8192,明显浪费,鉴于实际使用场景(每条文档的平均大小)调整成64尝试一阵子:
Xserver ➜  ~  sudo blockdev --getra /dev/mapper/homevg-homelv
8192

Xserver ➜  ~  sudo blockdev --getra /dev/mapper/homevg-homelv
8192
Xserver ➜  ~  sudo blockdev --setra 64 /dev/mapper/homevg-homelv
[sudo] password for master:
Xserver ➜  ~  sudo blockdev --getra /dev/mapper/homevg-homelv
64
还有一个推荐是官方的 “运维最佳实践三部曲” (名字我瞎起的)如果生产环境要搭Mongo了,读读这三部曲大有裨益。
END
做了这么多也算有立竿见影的地方,除了可用内存回升,优化前这几天MongoDB日常对CPU的占有率一般都是30%~60%,这两天做了一些优化后,除了建索引的时间段内,使用率居然降低在3%以下,已经不是系统最耗资源应用。
Ref 调查过程中各种实用文档:
MongoDB官方文档给出的优化建议是从数据库查询策略,硬件可用性,数据库连接数三个角度去看,多数性能问题因为这些引起。索引不合理,或文档结构不合理。
https://docs.mongodb.com/manual/administration/production-notes/
http://www.flyy.info/567.html
http://www.javawind.net/p131
http://blog.chinaunix.net/uid-7773824-id-5130096.html
http://ixdba.blog.51cto.com/2895551/715742/
http://www.voidcn.com/blog/xl890727/article/p-5723679.html
http://www.developer.com/db/tips-for-mongodb-wiredtiger-performance-tuning.html
http://www.php-oa.com/2009/02/03/iostat.html
http://www.xaprb.com/blog/2009/08/23/how-to-find-per-process-io-statistics-on-linux/
http://fishermen.iteye.com/blog/2288940
http://shift-alt-ctrl.iteye.com/blog/2255580
http://m.blog.chinaunix.net/uid-25691489-id-5581110.html
http://www.mongoing.com/eshu_explain3